
3 Common Investing Mistakes
Many people start out managing their own investments. But as their earnings and assets grow, their financial needs and challenges become more complex—and continuing to…


Some investors favor a dollar-cost averaging (“DCA”) approach to deploying their investment capital. Unlike lump-sum investing, in which the full amount of available capital is invested up front, DCA spreads out investment contributions using installments over time. The appeal of DCA is the perception that it helps investors “diversify” the cost of entry into the market, buying shares at prices that fall somewhere between the highs and lows of a fluctuating market. So what are the implications of DCA for investors aiming to generate long-term wealth?
Let’s take the hypothetical example of an investor with $12,000 in cash earmarked for investment in stocks. Instead of buying $12,000 in stocks today, an investor going the DCA route buys $1,000 worth of stocks each month for the next 12 months. If the market increases in value each month during this period, the DCA investor will pay a higher price on average than if investing all up front. If the market decreases steadily over the next 12 months, the opposite will be true.
While investors may focus on the prices paid for these installments, it’s important to remember that, unlike with the lump-sum approach, a meaningful portion of the investor’s capital is remaining in cash rather than gaining exposure to the stock market. During the process of capital deployment in this hypothetical example, half of the investable assets on average are forfeiting the higher expected returns of the stock market. For investors with the goal of accumulating wealth, this is potentially a big opportunity cost.
Despite the drawbacks of dollar-cost averaging, some may be hesitant to plunk down all their investable money at once. If markets have recently hit all-time highs, investors may wonder whether they have already missed the best returns and so ought to wait for a pullback before getting into the market. Conversely, if stocks have just fallen and news reports suggest more declines could be on the way, some investors might take that as a signal waiting to buy is the wiser course. Driving the similar reactions to these very different scenarios is one fear: what if I make an investment today and the price goes down tomorrow?
Exhibit 1 puts those fears in a broader context. It shows the average annualized compound returns of the S&P 500 from 1926–2019. After the index has hit all-time highs, the subsequent one-, three-, and five-year returns are positive, on average. After the S&P 500 has fallen more than 10%, the subsequent one-, three-, and five-year returns are also positive, on average. Both data sets show returns that outperform those of one-month Treasury bills. Overall, the data do not support that recent market performance should influence the timing of investing in stocks.
EXHIBIT 1
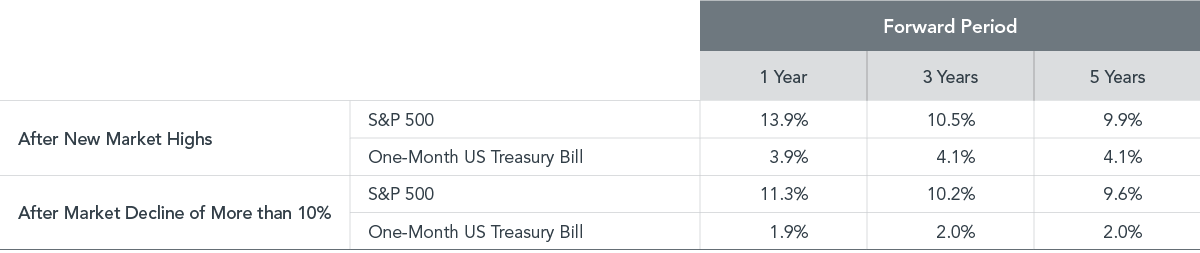
Past performance is not a guarantee of future results.
Both theory and data suggest that lump-sum investing is the more efficient approach to building wealth over time. But dollar-cost averaging may be a reasonable strategy for investors who might otherwise decide to stay out of the market altogether due to fears of a large downturn after investing a lump sum.
The stock market has offered a high average return historically, and it can be an important ally in helping investors reach their goals. Getting capital into stocks, whether gradually or all at once, puts the holder in position to reap the potential benefits. A trusted financial advisor can help investors decide which approach—lump-sum investing or dollar-cost averaging—is better for them. What’s clear is that markets have rewarded investors over time. Whichever method one pursues, the goal is the same: developing a plan and sticking with it.
Many people start out managing their own investments. But as their earnings and assets grow, their financial needs and challenges become more complex—and continuing to…

Beaird Harris is pleased to welcome three new partners: Nathan Biggs, Matt Edrington and Matt Skinner, to its public accounting practice, signifying the Firm’s continued…

Beaird Harris Named to Dallas Business Journal’s 2024 List of “Top 100 Money Managers.”