Blog

Investing Can Be a Roller Coaster: Three Tips for Riding Out the Ups and Downs

Picture of Tra Sullivan

Investing, like a roller coaster, has its ups and downs. One minute you’re climbing higher and the next a sudden decline makes your stomach drop. A few reminders can help investors to relax amid the turbulence.

1. Keep Your Eye on the Horizon

When you invest, you can expect that both ups and downs will be part of the ride. Decades of stock market returns demonstrate how often declines can happen. For evidence, look at the largest intrayear declines for the US stock market in every year from 1979 to 2023. Those declines average to -14%. However, 37 of the past 45 calendar years have ended with positive returns for the US stock market (see Exhibit 1). So instead of getting anxious over a near-term drop, keeping an eye on the horizon can help investors keep the queasiness at bay.

EXHIBIT 1
US Market Intrayear Gains and Declines vs. Calendar Year Returns (1979–2023)

2. Stay in Your Seat

When the stock market drops precipitously, or headlines speculate it might, it can be tempting to jump out of the market to try to avoid (further) losses. But just as roller-coaster riders are warned to keep their seat belts fastened and stay seated, investors may be well advised to do the same.

Attempting to time the market to avoid the worst days could cause an investor to miss out on some of the best days (see Exhibit 2). Consider that $1,000 invested in the S&P 500 Index back in 1990 would have grown to $27,221 by the end of 2023 if left untouched. However, if an investor had pulled their money out and missed the single best day over the more than 30-year period, their ending wealth would be reduced by nearly $3,000. Worse, if an investor had missed the five best single days, their ending wealth would be reduced by more than $10,000. Over the course of decades, even a few days can make a big difference.

EXHIBIT 2
S&P 500 Index Performance Based on Time in the Market (1990–2023)

Taking a step back from the current moment may provide investors helpful perspective and put fears at ease. Markets have marched upward through the decades, even amid concerning world events, and rewarded disciplined investors over time (see Exhibit 3). This reminds investors that, despite the extreme headlines and bumps experienced in the short term, you may have a better ride by staying in your seat.

EXHIBIT 3
Growth of a Dollar—MSCI World Index (Net Dividends) (1970–2023)


3. Know Your Thrill Tolerance

The same way theme-park goers can choose rides that align with their thrill tolerance, investors can choose an asset allocation that aligns with their risk tolerance. Financial advisors can play a key role in helping you do just that—by exploring your investment objectives and time horizons, and helping you build a diversified portfolio with the appropriate level of resilience (see Exhibit 4).

EXHIBIT 4
Stock-Bond Asset Allocation Performance (1985–2023)

Investing doesn’t have to be a harrowing, white-knuckle experience. A few simple reminders and the help of an investment professional can give you the confidence to ride out the rough patches.

Exhibits

  1. Indices are not available for direct investment; therefore, their performance does not reflect the expenses associated with the management of an actual portfolio. In USD. Data is calculated off rounded daily returns. US Market is the Russell 3000 Index. Largest Intrayear Gain refers to the largest market increase from trough to peak during the year. Largest Intrayear Decline refers to the largest market decrease from peak to trough during the year. Frank Russell Company is the source and owner of the trademarks, service marks, and copyrights related to the Russell Indexes.
  2. Indices are not available for direct investment; therefore, their performance does not reflect the expenses associated with the management of an actual portfolio. In USD. For illustrative purposes. The missed best day(s) examples assume that the hypothetical portfolio fully divested its holdings at the end of the day before the missed best day(s), held cash for the missed best day(s), and reinvested the entire portfolio in the S&P 500 at the end of the missed best day(s). Annualized returns for the missed best day(s) were calculated by substituting actual returns for the missed best day(s) with zero. S&P data © 2024 S&P Dow Jones Indices LLC, a division of S&P Global. All rights reserved. One-Month US T-Bills is the IA SBBI US 30 Day TBill TR USD, provided by Ibbotson Associates via Morningstar Direct. Data is calculated off rounded daily index values.
  3. Indices are not available for direct investment; therefore, their performance does not reflect the expenses associated with the management of an actual portfolio.
  4. Source: Dimensional Core Market Index Allocations See “Index Descriptions” for descriptions of the Dimensional index data. The Dimensional and Fama/French Indices represent academic concepts that may be used in portfolio construction and are not available for direct investment or for use as a benchmark. Index returns are not representative of actual portfolios and do not reflect costs and fees associated with an actual investment.

Footnotes

  1. The Dimensional Core Market 100/0 Index Allocation combines the following indices: Dimensional US Core Equity Market Index, Dimensional International Core Equity Market Index, Dimensional Emerging Markets Core Equity Market Index, and the S&P Global REIT Index (gross dividends).

  2. 80% of the weight is allocated to the Dimensional Core Market 100/0 Index Allocation, and 20% of the weight is allocated to the following indices: Dimensional Short-Term Extended Quality Index (10%) and Dimensional US Core Fixed Income Index (10%).

  3. 60% of the weight is allocated to the Dimensional Core Market 100/0 Index Allocation, and 40% of the weight is allocated to the following fixed income indices: Dimensional Short-Term Extended Quality Index (25%) and Dimensional US Core Fixed Income Index (15%).

  4. 40% of the weight is allocated to the Dimensional Core Market 100/0 Index Allocation, and 60% of the weight is allocated to the following indices: Dimensional Short-Term Extended Quality Index (40%) and Dimensional US Core Fixed Income Index (20%).

  5. 20% of the weight is allocated to the Dimensional Core Market 100/0 Index Allocation, and 80% of the weight is allocated to the following indices: Bloomberg US TIPS Index (10%), Dimensional US Ultra-Short Fixed Income Index (10%), Dimensional Short-Term Extended Quality Index (50%), and Dimensional US Core Fixed Income Index (10%).

  6. The Dimensional Core Market 0/100 Index Allocation combines the following indices: Bloomberg US TIPS Index (20%), Dimensional US Ultra Short Fixed Income Index (20%), and Dimensional Short-Term Extended Quality Index (60%).

Index Descriptions

The Dimensional Indices have been retrospectively calculated by Dimensional Fund Advisors LP and did not exist prior to their index inception dates. Accordingly, results shown during the periods prior to each index’s index inception date do not represent actual returns of the index. Other periods selected may have different results, including losses. Backtested index performance is hypothetical and is provided for informational purposes only to indicate historical performance had the index been calculated over the relevant time periods. Backtested performance results assume the reinvestment of dividends and capital gains.

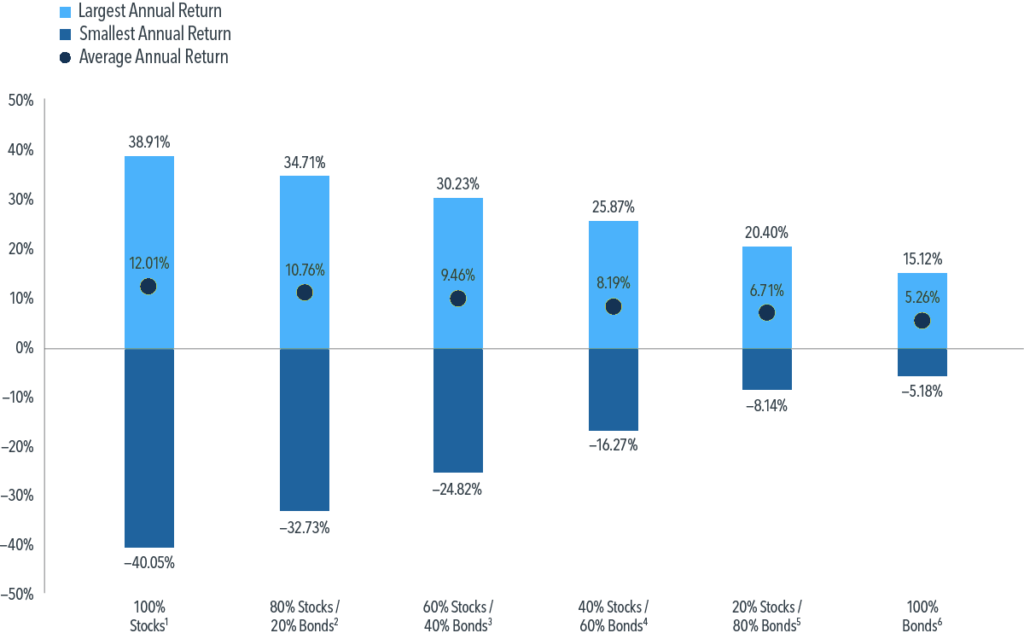
Dimensional Core Market 100/0 Index Allocation: Dimensional Index Allocation data compiled by Dimensional. The Dimensional Core Market 100/0 Index Allocation combines the following indices: Dimensional US Core Equity Market Index, Dimensional International Core Equity Market Index, Dimensional Emerging Markets Core Equity Market Index, and the S&P Global REIT Index (gross dividends). The weight of the REIT index is based on the market capitalization weight of equity REITs within the global universe of eligible stocks and equity REITs, rounded to the nearest 1%. Within the remaining non-REIT allocation, the US equities are overweight relative to their market capitalization weight. The weights of the US, Developed ex US, and Emerging Markets equities are then rescaled to sum to the total non-REIT weight of the Index Allocation and are all rounded to the nearest 1%. Regional weights are determined at each quarter end and held constant for next three months. The Index Allocation returns are calculated monthly as a weighted average of the returns of the underlying indices. The Index Allocation has been retrospectively calculated by Dimensional and did not exist prior to March 2020.

Dimensional Core Market 80/20 Index Allocation: Dimensional Index Allocation data compiled by Dimensional. 80% of the weight is allocated to the Dimensional Core Market 100/0 Index Allocation and 20% of the weight is allocated to the following fixed income indices: Dimensional Short-Term Extended Quality Index (10%) and Dimensional US Core Fixed Income Index (10%). The Index Allocation returns are calculated monthly as a weighted average of the returns of the underlying indices. The Dimensional Short-Term Extended Quality Index is represented by Bloomberg US Government/Credit 1–5 Year Bond Index from January 1985 to December 1995. The Dimensional US Core Fixed Income Index is represented by Bloomberg US Aggregate Bond Index from January 1985 to January 1989 and the US Government/Credit Simulation plus Bloomberg US Mortgage-Backed Securities Index (70% non MBS/30% MBS) from February 1989 to August 2005. The Index Allocation has been retrospectively calculated by Dimensional and did not exist prior to March 2020.

Dimensional Core Market 60/40 Index Allocation: Dimensional Index Allocation data compiled by Dimensional. 60% of the weight is allocated to the Dimensional Core Market 100/0 Index Allocation and 40% of the weight is allocated to the following indices: Dimensional Short-Term Extended Quality Index (25%) and Dimensional US Core Fixed Income Index (15%). The Index Allocation returns are calculated monthly as a weighted average of the returns of the underlying indices. The Dimensional Short-Term Extended Quality Index is represented by Bloomberg US Government/Credit 1–5 Year Bond Index from January 1985 to December 1995. The Dimensional US Core Fixed Income Index is represented by Bloomberg US Aggregate Bond Index from January 1985 to January 1989 and the US Government/Credit Simulation plus Bloomberg US Mortgage-Backed Securities Index (70% non MBS/30% MBS) from February 1989 to August 2005. The Index Allocation has been retrospectively calculated by Dimensional and did not exist prior to March 2020.

Dimensional Core Market 40/60 Index Allocation: Dimensional Index Allocation data compiled by Dimensional. 40% of the weight is allocated to the Dimensional Core Market 100/0 Index Allocation and 60% of the weight is allocated to the following indices: Dimensional Short-Term Extended Quality Index (40%) and Dimensional US Core Fixed Income Index (20%). The Index Allocation returns are calculated monthly as a weighted average of the returns of the underlying indices. The Dimensional Short-Term Extended Quality Index is represented by Bloomberg US Government/Credit 1–5 Year Bond Index from January 1985 to December 1995. The Dimensional US Core Fixed Income Index is represented by Bloomberg US Aggregate Bond Index from January 1985 to January 1989 and the US Government/Credit Simulation plus Bloomberg US Mortgage-Backed Securities Index (70% non MBS/30% MBS) from February 1989 to August 2005. The Index Allocation has been retrospectively calculated by Dimensional and did not exist prior to March 2020.

Dimensional Core Market 20/80 Index Allocation: Dimensional Index Allocation data compiled by Dimensional. 20% of the weight is allocated to the Dimensional Core Market 100/0 Index Allocation and 80% of the weight is allocated to the following indices: Bloomberg US TIPS Index (10%), Dimensional US Ultra-Short Fixed Income Index (10%), Dimensional Short-Term Extended Quality Index (50%), and Dimensional US Core Fixed Income Index (10%). The Index Allocation returns are calculated monthly as a weighted average of the returns of the underlying indices. The Dimensional Short-Term Extended Quality Index is represented by Bloomberg US Government/Credit 1–5 Year Bond Index from January 1985 to December 1995. The Dimensional US Core Fixed Income Index is represented by Bloomberg US Aggregate Bond Index from January 1985 to January 1989 and the US Government/Credit Simulation plus Bloomberg US Mortgage-Backed Securities Index (70% non MBS/30% MBS) from February 1989 to August 2005. The Bloomberg US TIPS Index is represented by the Bloomberg US Treasury Bond Index from January 1985 to February 1997. The Dimensional US Ultra-Short Fixed Income Index is represented by the ICE BofA US 3-Month Treasury Bill Index from January 1985 to January 1999. The Index Allocation has been retrospectively calculated by Dimensional and did not exist prior to March 2020.

Dimensional Core Market 0/100 Index Allocation: Dimensional Index Allocation data compiled by Dimensional. The Dimensional Core Market 0/100 Index Allocation combines the following indices: Bloomberg US TIPS Index (20%), Dimensional US Ultra Short Fixed Income Index (20%), and Dimensional Short-Term Extended Quality Index (60%). The Index Allocation returns are calculated monthly as a weighted average of the returns of the underlying indices. The Dimensional Short-Term Extended Quality Index is represented by Bloomberg US Government/Credit 1–5 Year Bond Index from January 1985 to December 1995. The Bloomberg US TIPS Index is represented by the Bloomberg US Treasury Bond Index from January 1985 to February 1997. The Dimensional US Ultra-Short Fixed Income Index is represented by the ICE BofA US 3-Month Treasury Bill Index from January 1985 to January 1999. The Index Allocation has been retrospectively calculated by Dimensional and did not exist prior to March 2020.

Disclosures

The information in this material is intended for the recipient’s background information and use only. It is provided in good faith and without any warranty or representation as to accuracy or completeness. Information and opinions presented in this material have been obtained or derived from sources believed by Beaird Harris to be reliable, and Beaird Harris has reasonable grounds to believe that all factual information herein is true as at the date of this material. It does not constitute investment advice, a recommendation, or an offer of any services or products for sale and is not intended to provide a sufficient basis on which to make an investment decision. Before acting on any information in this document, you should consider whether it is appropriate for your particular circumstances and, if appropriate, seek professional advice. It is the responsibility of any persons wishing to make a purchase to inform themselves of and observe all applicable laws and regulations. Beaird Harris accepts no responsibility for loss arising from the use of the information contained herein.

Please remember that past performance may not be indicative of future results. Different types of investments involve varying degrees of risk, and there can be no assurance that the future performance of any specific investment, investment strategy, or product (including the investments and/or investment strategies recommended or undertaken by Beaird Harris Wealth Management, LLC), or any non-investment related content, made reference to directly or indirectly in this blog will be profitable, equal any corresponding indicated historical performance level(s), be suitable for your portfolio or individual situation, or prove successful.  Due to various factors, including changing market conditions and/or applicable laws, the content may no longer be reflective of current opinions or positions.  Moreover, you should not assume that any discussion or information contained in this blog serves as the receipt of, or as a substitute for, personalized investment advice from Beaird Harris Wealth Management, LLC.  To the extent that a reader has any questions regarding the applicability of any specific issue discussed above to his/her individual situation, he/she is encouraged to consult with the professional advisor of his/her choosing. Beaird Harris Wealth Management, LLC is neither a law firm nor a certified public accounting firm and no portion of the blog content should be construed as legal or accounting advice. A copy of the Beaird Harris Wealth Management, LLC’s current written disclosure statement discussing our advisory services and fees is available for review upon request.

Share This

Let's Talk

Curious to see if we’re a good fit? 

Schedule a complimentary call today. We’ll help you get started and learn more about Beaird Harris.