Footnotes:
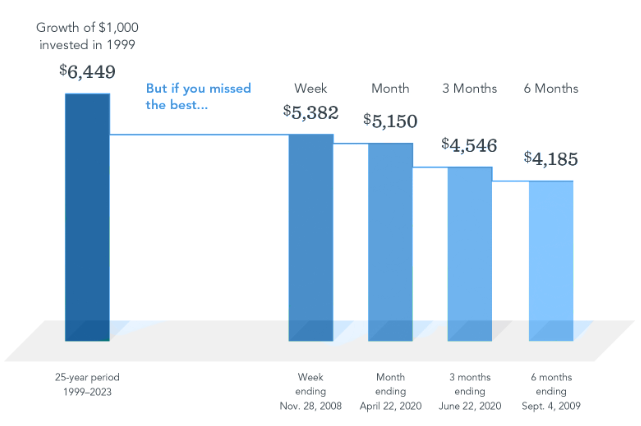
- In USD. For illustrative purposes. Best performance dates represent end of period (November 28, 2008, for best week; April 22, 2020, for best month; June 22, 2020, for best three months; and September 4, 2009, for best six months). The missed best consecutive days examples assume that the hypothetical portfolio fully divested its holdings at the end of the day before the missed best consecutive days, held cash for the missed best consecutive days, and reinvested the entire portfolio in the Russell 3000 Index at the end of the missed best consecutive days. Data presented in the growth of $1,000 exhibit is hypothetical and assumes reinvestment of income and no transaction costs or taxes. The data is for illustrative purposes only and is not indicative of any investment. Frank Russell Company is the source and owner of the trademarks, service marks, and copyrights related to the Russell Indexes.
- In USD. For illustrative purposes. Best performance dates represent end of period (November 28, 2008, for best week; April 22, 2020, for best month; June 22, 2020, for best three months; and September 4, 2009, for best six months). The missed best consecutive days examples assume that the hypothetical portfolio fully divested its holdings at the end of the day before the missed best consecutive days, held cash for the missed best consecutive days, and reinvested the entire portfolio in the Russell 3000 Index at the end of the missed best consecutive days. Data presented in the growth of $1,000 exhibit is hypothetical and assumes reinvestment of income and no transaction costs or taxes. The data is for illustrative purposes only and is not indicative of any investment. Frank Russell Company is the source and owner of the trademarks, service marks, and copyrights related to the Russell Indexes.
Data Sample
The sample includes US-domiciled, USD-denominated open-end and exchange-traded funds (ETFs) in the following Morningstar categories. Non-Dimensional fund data provided by Morningstar. Dimensional fund data is provided by the fund accountant. Dimensional funds or subadvised funds whose access is or previously was limited to certain investors are excluded. Index funds, load-waived funds, and funds of funds are excluded from the industry sample.
Methodology
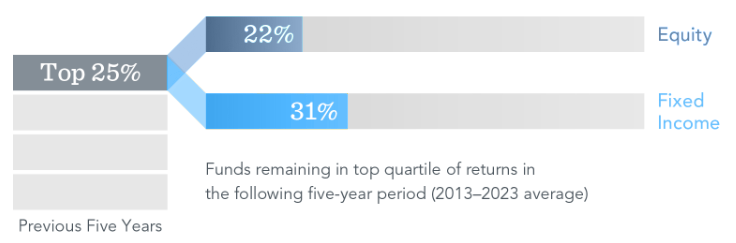
This study evaluated fund performance over rolling periods from 2004 through 2023. Each year, funds are sorted within their category based on their previous five-year total return. Those ranked in the top quartile of returns are evaluated over the following five-year period. The chart shows the average percentage of top-ranked equity and fixed income funds that kept their top ranking in the subsequent period.
Morningstar Categories (Equity)
Equity fund sample includes the following Morningstar historical categories: Diversified Emerging Markets, Europe Stock, Foreign Large Blend, Foreign Large Growth, Foreign Large Value, Foreign Small/Mid Blend, Foreign Small/Mid Growth, Foreign Small/Mid Value, Global Real Estate, Japan Stock, Large Blend, Large Growth, Large Value, Mid-Cap Blend, Mid-Cap Growth, Mid-Cap Value, Miscellaneous Region, Pacific/Asia ex-Japan Stock, Real Estate, Small Blend, Small Growth, Small Value, Global Large-Stock Blend, Global Large-Stock Growth, Global Large-Stock Value, and Global Small/Mid Stock.
Morningstar Categories (Fixed Income)
Fixed income fund sample includes the following Morningstar historical categories: Corporate Bond, High-Yield Bond, Inflation-Protected Bond, Intermediate Core Bond, Intermediate Core-Plus Bond, Intermediate Government, Long Government, Muni California Intermediate, Muni California Long, Muni Massachusetts, Muni Minnesota, Muni National Intermediate, Muni National Long, Muni National Short, Muni New Jersey, Muni New York Intermediate, Muni New York Long, Muni Ohio, Muni Pennsylvania, Muni Single State Intermediate, Muni Single State Long, Muni Single State Short, Muni Target Maturity, Short Government, Short-Term Bond, Ultrashort Bond, Global Bond, and Global Bond-USD Hedged.
Index Data Sources
Index data provided by Bloomberg, MSCI, Russell, FTSE Fixed Income LLC, and S&P Dow Jones Indices LLC. Bloomberg data provided by Bloomberg. MSCI data © MSCI 2024, all rights reserved. Frank Russell Company is the source and owner of the trademarks, service marks, and copyrights related to the Russell Indexes. FTSE fixed income indices © 2024 FTSE Fixed Income LLC. All rights reserved. S&P data © 2024 S&P Dow Jones Indices LLC, a division of S&P Global. All rights reserved.
Indices are not available for direct investment. Their performance does not reflect the expenses associated with management of an actual portfolio. US-domiciled mutual funds and US-domiciled ETFs are not generally available for distribution outside the US.
Disclosures:
This information is intended for educational purposes and should not be considered a recommendation to buy or sell a particular security. Named securities may be held in accounts managed by Beaird Harris.
Fama/French Total US Market Research Index: The value-weighted US market index is constructed every month using all issues listed on the NYSE, AMEX, or Nasdaq with available outstanding shares and valid prices for that month and the month before. Exclusion: American depositary receipts. Source: CRSP for value-weighted US market return. Rebalancing: monthly. Dividends: reinvested in the paying company until the portfolio is rebalanced.
The Fama/French indices represent academic concepts that may be used in portfolio construction and are not available for direct investment or for use as a benchmark. Index returns are not representative of actual portfolios and do not reflect costs and fees associated with an actual investment.
Results shown during periods prior to each Index’s index inception date do not represent actual returns of the respective index. Other periods selected may have different results, including losses. Backtested index performance is hypothetical and is provided for informational purposes only to indicate historical performance had the index been calculated over the relevant time periods. Backtested performance results assume the reinvestment of dividends and capital gains.
Risks include loss of principal and fluctuating value. Investment value will fluctuate, and shares, when redeemed, may be worth more or less than their original cost. Diversification does not eliminate the risk of market loss.
Please remember that past performance may not be indicative of future results. Different types of investments involve varying degrees of risk, and there can be no assurance that the future performance of any specific investment, investment strategy, or product (including the investments and/or investment strategies recommended or undertaken by Beaird Harris Wealth Management, LLC), or any non-investment related content, made reference to directly or indirectly in this blog will be profitable, equal any corresponding indicated historical performance level(s), be suitable for your portfolio or individual situation, or prove successful. Due to various factors, including changing market conditions and/or applicable laws, the content may no longer be reflective of current opinions or positions. Moreover, you should not assume that any discussion or information contained in this blog serves as the receipt of, or as a substitute for, personalized investment advice from Beaird Harris Wealth Management, LLC. To the extent that a reader has any questions regarding the applicability of any specific issue discussed above to his/her individual situation, he/she is encouraged to consult with the professional advisor of his/her choosing. Beaird Harris Wealth Management, LLC is neither a law firm nor a certified public accounting firm and no portion of the blog content should be construed as legal or accounting advice. A copy of the Beaird Harris Wealth Management, LLC’s current written disclosure statement discussing our advisory services and fees is available for review upon request.