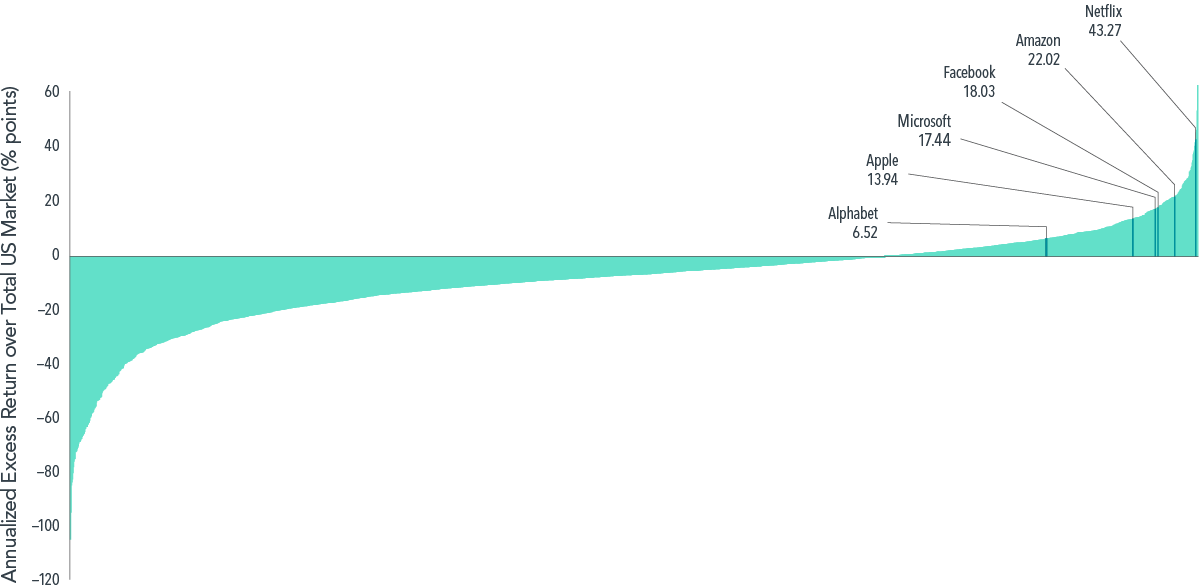
A handful of large technology stocks have garnered attention for outsize returns in recent years. Collectively referred to by the FANMAG acronym, Facebook, Amazon, Netflix, Microsoft, Apple, and Google (now trading as Alphabet) all substantially outperformed the US market1 in the eight calendar years that they have all been public companies (Facebook went public in May 2012).2 Emerging as winners from among a large number of companies that fared less well during 2013–2020,3 these juggernauts bested most of their surviving peers with annualized outperformance versus the US market ranging from 7.31 (Alphabet) to 42.58 percentage points (Netflix), as shown in Exhibit 1.
EXHIBIT 1
At the Top of Their Game
Annualized compound return in excess of US market, January 2013–November 2020
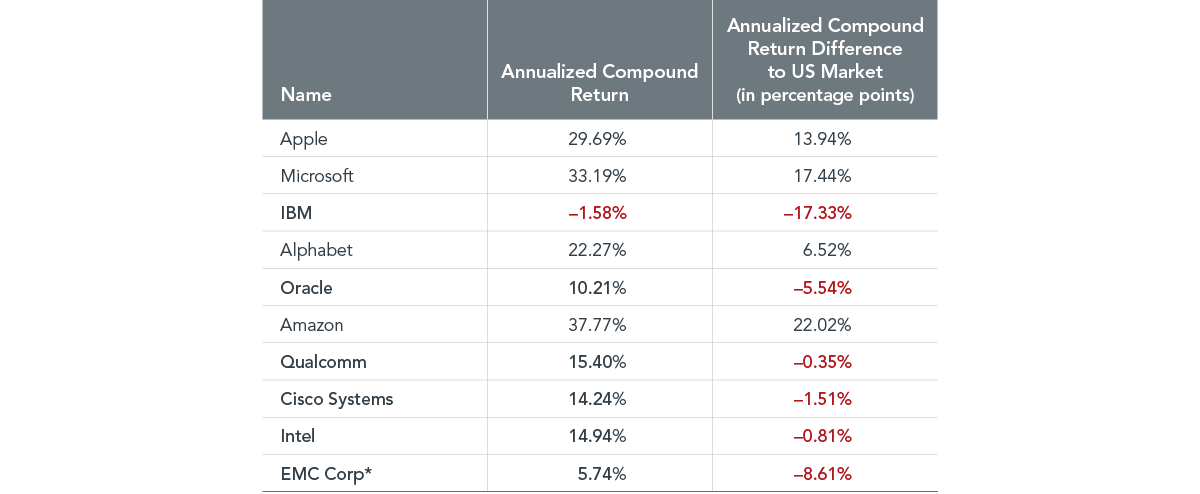
EXHIBIT 2
Same Game, Different Outcome
Performance of the 10 largest US technology stocks as of January 2013 from January 2013 to November 2020
Past performance is no guarantee of future results. In USD. *EMC Corp. return covers the period from January 2013 until the firm’s delisting in September 2016. Data from CRSP and Compustat for time period 2013–November 2020. US market is defined as Fama/French Total US Market Research Index. Companies ranked by beginning-of-period market capitalization from largest to smallest. Technology stocks identified using the Fama/French 10 Industry High-Tech Sector.
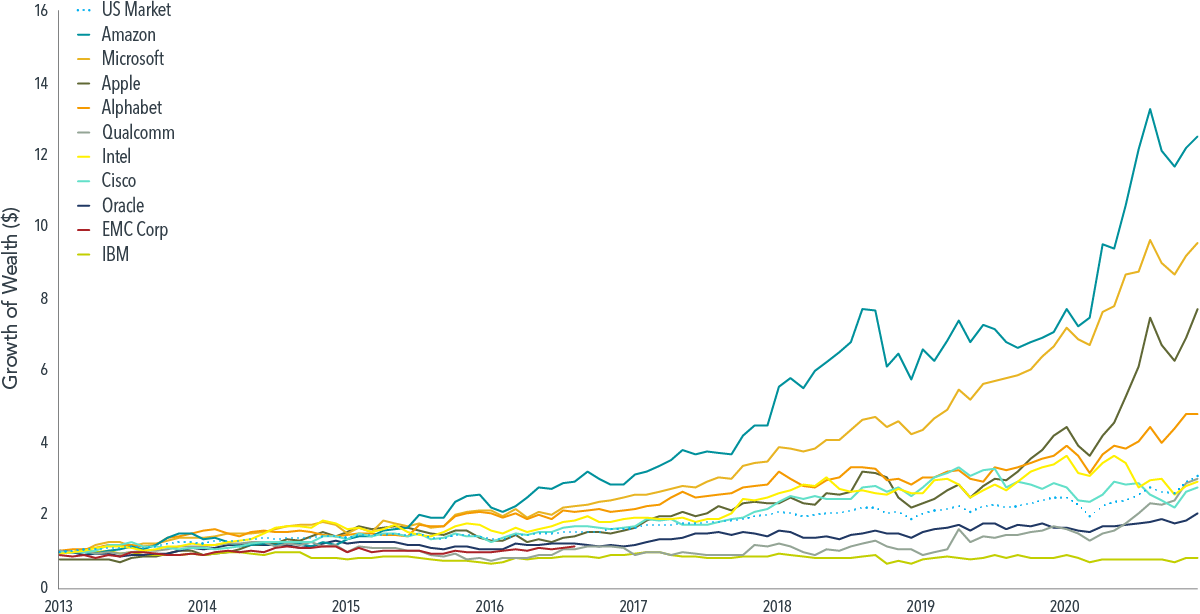
EXHIBIT 3
Growth of Wealth
Growth of wealth for 10 largest US technology stocks as of January 2013 and US market, January 2013–November 2020
Past performance, including hypothetical performance, is no guarantee of future results. In USD. Data from CRSP and Compustat for time period January 2013–November 2020. Performance includes reinvestment of dividends and capital gains. Data presented in the Growth of $1 chart is hypothetical and assumes reinvestment of income and no transaction costs or taxes. The chart is for illustrative purposes only and is not indicative of any investment. Indices are not available for direct investment; therefore, their performance does not reflect the expenses associated with the management of an actual portfolio. US market is defined as Fama/French Total US Market Research Index.
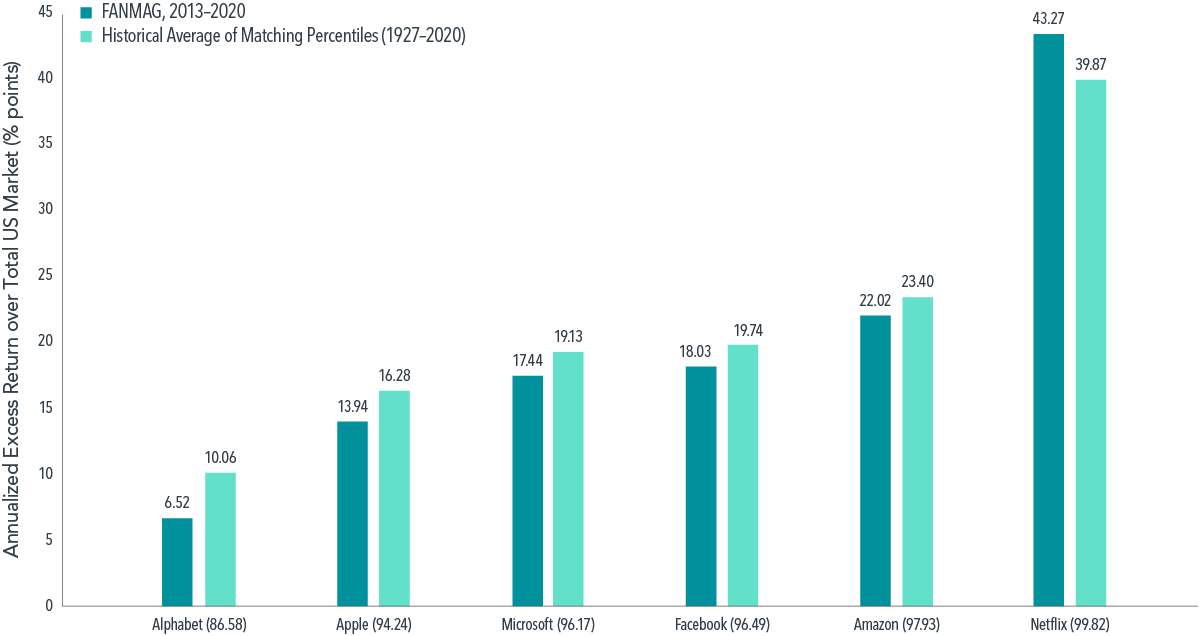
EXHIBIT 4
A Familiar Tale for the Right Tail
FANMAG outperformance vs. US market, 2013–2020, compared to average historical outperformance of stocks at same return distribution percentile over rolling eight-year periods, 1927–2020
Past performance is no guarantee of future results. In USD. Data from CRSP and Compustat for time period 1927–November 2020. US market defined as Fama/French Total US Market Research Index. Next to each FANMAG stock in parenthesis is its corresponding percentile rank of annualized returns excess of the market between January 2013 and November 2020, computed from among stocks that survived the 95-month period.
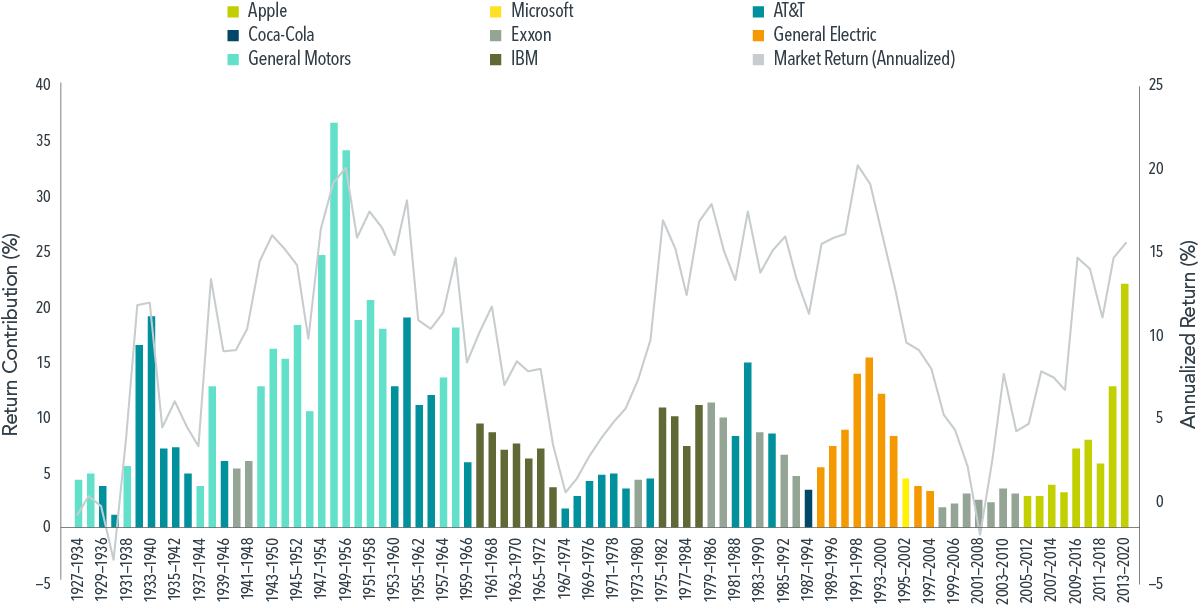
EXHIBIT 5
Key Contributors
Past performance is no guarantee of future results. In USD. Data from CRSP and Compustat for time period 1927–November 2020. A stock’s return contribution is defined as its total cumulative return over eight years weighted by its beginning-of-period market capitalization weight. Each bar represents the top return contributing stock, and the solid black line shows the annualized US market return over rolling eight-year windows. US market defined as Fama/French Total US Market Research Index.
If history is any guide, the FANMAG acronym will eventually be replaced by another trendy name. For example, stock market historians will remember the Nifty Fifty in the 1960s and 70s, a set of 50 blue-chip stocks like Coca-Cola and General Electric. The early 2000s witnessed increasing adoption of the acronym BRIC, representing investment opportunities in the fast-growing emerging economies of Brazil, Russia, India, and China. More recently, the WATCH companies—Walmart, Amazon, Target, Costco, and Home Depot—have also gained traction in the market’s lexicon.
While documenting trends in finance is entertaining, there is little evidence that investors can spot these trends in advance in a way that would enable market-beating performance. Moreover, concentrated bets on high-flying stocks can expose investors to idiosyncratic risks and a wider range of possible outcomes. By contrast, a sound investment approach based on financial science emphasizes the importance of broadly diversified portfolios that provide exposure to a vast array of companies and sectors to help manage risks, increase flexibility in implementation, and increase the reliability of outcomes.